

Prompt Details
Model
(claude-5-5-sonnet)
Token size
3,867
Example input
[AGENT_USE_CASE_AND_WORKLOAD]: We operate a support triage agent handling approximately 18,000 tickets per month. It classifies incoming tickets, retrieves account and documentation context, drafts a response, and escalates complex cases to a human. Before the agent, first-line triage averaged around six minutes per ticket. During the pilot, 62% of drafts are accepted without revision, 24% are edited by support staff, and the remainder are discarded or escalated.
[ECONOMIC_INPUTS_AND_CONSTRAINTS]: We know monthly model/API spend, reviewer hours, infrastructure costs, and the loaded cost of support employees. Management wants to decide whether to deploy the agent across the full support operation. We have measured faster ticket handling but do not have credible evidence that the agent improves customer retention or revenue.
Example output
# 1. EXECUTIVE ECONOMIC DECISION
**DECISION: PILOT WITH MEASUREMENT** (expand in gated stages, not full deployment)
Your acceptance data is strong enough to make value plausible: 62% of drafts are accepted without revision. But the dollar inputs (spend, reviewer hours, loaded rates), the post-agent handling time, and any downstream quality signals have not been supplied. Without them, cost per accepted outcome, labor savings, and ROI cannot yet be defended. Faster handling is an operational benefit, not yet a financial one.
---
# 2. EVIDENCE & ASSUMPTION REGISTER
| Item | Class | Value | Confidence |
|---|---|---|---|
| Monthly ticket volume | MEASURED (approximate) | ~18,000 | MEDIUM |
| Pre-agent triage time | USER ESTIMATE ("around six minutes") | ~6 min/ticket | MEDIUM-LOW |
| Drafts accepted without revision | MEASURED | 62% | MEDIUM (denominator unclear) |
| Drafts edited by staff | MEASURED | 24% | MEDIUM |
| Discarded or escalated | MEASURED (residual) | 14% | MEDIUM; two outcomes merged |
| Model/API spend, infra, reviewer hours | EXISTS, VALUE NOT SUPPLIED | n/a | UNKNOWN to this analysis |
| Loaded support employee cost | EXISTS, VALUE NOT SUPPLIED | n/a | UNKNOWN to this analysis |
| Agent-assisted handling time | "Faster" reported, magnitude not supplied | n/a | UNKNOWN |
| Retention/revenue impact | No credible evidence | n/a | UNKNOWN (treated as zero value) |
| Downstream quality (reopens, CSAT, wrong-answer incidents) | Not supplied | n/a | UNKNOWN |
**DERIVED (from 18,000 tickets, assuming every ticket receives a draft):**
- Accepted without revision: ~11,160
- Edited: ~4,320
- Discarded or escalated: ~2,520
- Baseline triage workload: 18,000 × 6 min = 108,000 min ≈ **1,800 hours/month** (a ceiling on addressable effort, not savings)
---
# 3. BASELINE / COUNTERFACTUAL
- **Current cost per task (pre-agent):** NOT CALCULABLE in dollars. The 6 minutes is known, but the rate was not supplied.
- **Current human effort:** ~6 min/ticket, ~1,800 hrs/month at current volume.
- **Cycle time, throughput, error/rework, capacity, business outcome:** not supplied for the baseline.
- **Comparison basis:** USER ESTIMATE / HISTORICAL BASELINE. It is not a control group.
**Attribution caution:** Before/after speed gains could also reflect seasonal ticket mix, product changes, staffing changes, or simpler tickets reaching the agent. A concurrent control (some tickets or queues handled without the agent) is needed to attribute the gain to the agent.
**Conclusions this baseline cannot yet support:** dollar savings, payback, and any claim that "6 minutes" fully becomes savings.
---
# 4. ACCEPTED-OUTCOME DEFINITION
**ACCEPTED OUTCOME DEFINITION REQUIRED**, partially.
Working definition: a draft sent or actioned with no revision, and no downstream recovery.
Gaps to close:
1. **Acceptance ≠ correctness.** "Accepted without revision" is a reviewer judgment at one moment. Add a downstream criterion: no reopen, no re-contact, and no wrong-answer incident within a defined window (e.g., N days).
2. **Edited drafts (24%).** Decide whether they count as accepted. Recommendation: count them as partial outcomes only if edit time is below from-scratch time; otherwise they are cost, not value.
3. **Discarded vs. escalated (14%).** Separate them. A correct escalation of a genuinely complex case is the agent working as designed. A discard is waste.
4. **Denominator.** Confirm whether 62% is of all tickets or only of tickets the agent attempted.
---
# 5. FULL COST STACK
| Category | Status |
|---|---|
| A. Enablement/fixed (build, integration, eval setup, training, governance) | UNKNOWN |
| B. Model cost | KNOWN to exist; amount not supplied |
| C. Tool & data (retrieval, account/doc lookups) | UNKNOWN (retrieval cost not itemized) |
| D. Infrastructure | KNOWN to exist; amount not supplied |
| E. Human-in-the-loop (review, edits, escalations) | KNOWN to exist (reviewer hours tracked); amount not supplied |
| F. Failure/rework (discards, wrong-answer recovery, reopened tickets) | UNKNOWN |
| G. Operations (prompt/eval maintenance, monitoring, incident response) | UNKNOWN |
Watch for double-counting: reviewer hours and the support staff who edit drafts are likely the same labor pool.
---
# 6. UNIT ECONOMICS
- Attempted tasks: ~18,000 (assumed)
- Accepted outcomes (strict): ~11,160 (62%)
- Edited: ~4,320 (24%)
- Discarded/escalated: ~2,520 (14%)
**COST PER ACCEPTED OUTCOME: NOT YET CALCULABLE.**
The formula is Total Attributable Cost (model + retrieval + infra + reviewer labor + failure/rework + ops + amortized fixed) ÷ 11,160. Only the denominator is supported.
**Structural point:** the numerator includes the cost of all 18,000 attempts, so the accepted-outcome cost is roughly 1.6× the cost per attempt before reviewer labor. This is why cost per attempt understates the true unit cost.
---
# 7. BUSINESS VALUE STACK
- **Realized financial value:** none defensible yet. No verified labor spend reduction, no revenue or retention evidence.
- **Operational value (supported):** faster ticket handling, measured but not quantified in this input; potential capacity returned.
- **Quality value:** unproven. 62% acceptance is an output-quality signal, not a customer-outcome signal.
- **Strategic/option value:** data and workflow foundation for further automation, learning value. Real, but not dollar-convertible.
---
# 8. TIME-RETURNED ANALYSIS
| Gate | Status |
|---|---|
| Time returned | UNKNOWN. Needs post-agent minutes per ticket, including review. |
| Time redeployed | UNKNOWN |
| Paid capacity avoided (hiring avoided, overtime or contractor cut) | UNKNOWN |
| Actual labor spend reduction | NONE VERIFIED |
**Realized labor value = hours returned × loaded rate × realization factor.** Rate exists, but hours and realization factor are missing, so the result is reported as operational value, not savings.
**Per-ticket break-even test:**
Net minutes saved ≈ 6 − [0.62·T_review + 0.24·T_edit + 0.14·T_exception]
If edit time or exception handling approaches the 6-minute baseline, the savings on 38% of tickets shrink or vanish. The 62% acceptance rate only helps if review of an accepted draft is much faster than 6 minutes.
---
# 9. QUALITY & FAILURE ECONOMICS
- **Discards/escalations (~2,520/month):** attempt cost is incurred and the human still does the work. Separate waste from correct escalation.
- **Edits (~4,320/month):** the agent may help or hurt. A bad draft can take longer to fix than a fresh write.
- **False acceptance:** an unrevised draft that is wrong. This is the highest-risk unknown, because a small false-accept rate on ~11,000 tickets can generate re-contacts, refunds, or complaints that offset speed gains.
- **Downstream incidents, duplicate actions:** not measured.
**Verdict:** a low apparent run cost is not evidence of good economics until reopen/re-contact rates on accepted drafts are known.
---
# 10. STAGE-LEVEL COST MAP
| Stage | Frequency | Cost driver | Value contribution | Waste signal | Optimization possibility |
|---|---|---|---|---|---|
| Classification/routing | 100% of tickets | Model call | Enables routing and early exit | Misroutes | Smaller model; deterministic rules for clear categories |
| Retrieval (account + docs) | Likely most tickets | API/retrieval calls, context size | Drives draft quality | Retrieved context unused | Cache; fetch only for categories that need it |
| Draft generation | Likely 100% | Input/output tokens | Core output | Discarded drafts (~14%) | Skip drafting for categories predicted to escalate |
| Human review/edit | 100% (implied) | Reviewer time | Quality gate | Reviewing drafts that are always accepted | Risk-tiered review |
| Escalation/recovery | ~14%+ | Human time | Handles complexity | Late escalation | Earlier exit |
**Likely largest driver:** human review labor, not model spend. This is a hypothesis to verify, not an established fact.
---
# 11. SCALE ECONOMICS
- **Fixed:** build, evals, governance (unknown).
- **Variable:** model, retrieval, reviewer time (scales with tickets).
- **Step-function (possible):** additional languages, product lines, or ticket types requiring new retrieval sources, evals, and review staffing; monitoring and incident response; reviewer capacity limits.
**Unit economics at scale: CANNOT BE DETERMINED.**
Main risk: the 62% rate came from the pilot's ticket mix. "Full support operation" likely includes harder or different ticket types, so acceptance may drop and the cost per accepted outcome may rise. Variable cost per ticket probably stays roughly flat, so scale improves economics only if fixed costs are material relative to volume.
---
# 12. ROI / PAYBACK ANALYSIS
**FINANCIAL ROI NOT YET DEFENSIBLE.**
Missing: cost amounts, hours returned, realization factor, fixed investment. Payback and break-even accepted outcomes are not calculable. No retention or revenue benefit is counted.
---
# 13. SENSITIVITY & UNCERTAINTY
1. **Review/edit time per ticket (by outcome class):** the biggest swing in net time saved. Measure with timestamps, not self-report.
2. **Realization of returned time:** returned hours only become savings if headcount, overtime, or hiring changes. If staff are simply redeployed, there is no spend reduction.
3. **False-accept / downstream failure rate:** could turn savings negative. Measure reopens, re-contacts, and QA audits of accepted drafts.
4. **Acceptance-rate transfer to the full operation:** measure by ticket category and difficulty.
5. **Baseline validity (6 min):** if the true baseline is lower, savings shrink proportionally.
**Assumption most likely to reverse the decision:** review/edit time. If reviewing an accepted draft takes close to 6 minutes, the agent mostly moves work rather than removing it.
---
# 14. ALTERNATIVE PATH TEST
- **Deterministic automation:** classification and routing of clear categories may capture much of the triage value cheaply.
- **Copilot/human-assisted:** the 24% edited drafts already behave like a copilot. This may be the right permanent mode for complex categories.
- **Agentic autonomy needed?** Not shown. Retrieve-and-draft with human review is closer to a copilot than a true autonomous agent.
- **Is review eating the benefit?** Unknown; this is the key test.
- **Over-engineered?** Unknown until stage costs are itemized.
Do not assume the full agent beats a simpler router plus draft assistant until cost per accepted outcome is compared across configurations.
---
# 15. OPTIMIZATION LEVERS
| Lever | Target driver | Mechanism | Risk | Experiment |
|---|---|---|---|---|
| Targeted human review | Review labor | Spot-check high-confidence categories instead of reviewing everything | False-accepts rise | Audit sample in a low-risk category; compare error rates |
| Early exit / better routing | Wasted drafts (~14%) | Skip drafting for likely escalations | Missed easy tickets | Offline replay on historical escalations |
| Deterministic routing for clear categories | Classification model cost | Rules instead of a model call | Edge-case misroutes | A/B on top categories |
| Retrieval reduction/caching | Retrieval + context tokens | Fetch only what the category needs | Lower draft quality | Compare acceptance with trimmed context |
| Edit-reason tagging | Acceptance rate | Learn why 24% are edited; fix top causes | Low | Tag edit reasons for 2–4 weeks |
---
# 16. AGENT ECONOMICS DECISION PACK
**DECISION:** PILOT WITH MEASUREMENT
**ECONOMIC UNIT:** one ticket draft accepted without revision and with no downstream recovery within a defined window
**COST PER ACCEPTED OUTCOME:** NOT YET CALCULABLE (denominator ≈ 11,160/month; numerator not supplied)
**REALIZED VALUE:** none financially defensible yet
**OPERATIONAL VALUE:** faster ticket handling (measured, magnitude not supplied); 62% of drafts accepted without edits
**ROI STATUS:** NOT CALCULABLE
**PRIMARY COST DRIVER:** hypothesis only: human review/edit labor (to verify against itemized spend)
**PRIMARY VALUE DRIVER:** reduction in first-line handling time on accepted drafts, subject to realization
**BIGGEST ECONOMIC UNKNOWN:** net handling time per ticket after review/edit, combined with whether returned time converts into real labor spend reduction
**DO NOT COUNT AS ROI:**
- Faster handling that hasn't changed headcount, overtime, or hiring
- Retention or revenue effects (no credible evidence)
- Time on edited drafts
- Strategic or learning value
- Gross 1,800-hour baseline as "savings"
**BEST OPTIMIZATION LEVER:** targeted human review on high-confidence categories, since review labor is the likely dominant cost. Verify this first.
**FIRST MEASUREMENT:** timestamped minutes per ticket for each outcome class (accepted, edited, escalated, discarded), against a concurrent no-agent control slice
**SCALE GATE:**
1. Itemized monthly cost, so cost per accepted outcome can be computed
2. Net minutes saved per ticket exceeds a threshold agreed with finance
3. Acceptance rate holds on category-level samples from the wider operation
4. Downstream reopen/re-contact on accepted drafts is no worse than baseline
5. A defined path for realizing time returned (hiring avoided, overtime reduced, or documented redeployment)
**STOP / REDESIGN TRIGGER:**
- Review plus edit time on 38% of tickets is close to or above the 6-minute baseline
- Reopen or error rates on accepted drafts exceed baseline
- Acceptance drops materially on new ticket categories
- Cost per accepted outcome exceeds the loaded cost of the human alternative
**NEXT ACTION:** run a 4-week instrumented comparison in one new queue: log per-ticket handling time by outcome class, tag edit reasons, keep a control slice without the agent, and pull the cost lines (model, retrieval, infra, reviewer hours) into one sheet so cost per accepted outcome can be computed.

$19.99-25%
$14.99
SPECIAL PROMOTION — Offer ends 12 October

 Instant access
 Commercial use
 Money‑back
By purchasing this prompt, you agree to our terms of service
1
Favorites
19
Views
CLAUDE-5-5-SONNET


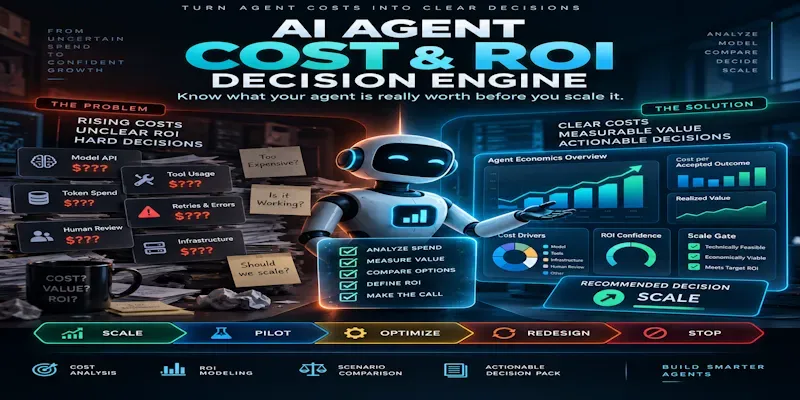
Measure whether an AI agent is actually worth scaling. This prompt calculates cost per accepted outcome, separates realized financial value from time saved, maps model, tool, infrastructure, human-review, failure, and operations costs, tests scale economics, compares simpler alternatives, and identifies the highest-value optimization lever. It ends with a defensible SCALE, PILOT, OPTIMIZE, REDESIGN, STOP, or INSUFFICIENT EVIDENCE decision.
...more
Added 1 week ago
