

Prompt Details
Model
(claude-5-opus)
Token size
4,565
Example input
[AGENT_TRACE_OR_LOG]: LangSmith execution trace for a customer-support ReAct agent that repeatedly calls the search tool before answering.
[WIDTH_METRIC]: Latency+script
[PRIMARY_FRICTION]: Slow runs
[PREVIOUS_RUN_NOTES]: None
Example output
# DEMONSTRATION RUN — built-in sample trace
**Fallback trigger:** `{AGENT_TRACE_OR_LOG}` is a prose description, not a trace — STEP_COUNT = 1, NUMERIC_COUNT = 0 (both below threshold). Width metric → `auto` (resolved to **latency**, matching stated friction). Friction inherited: **slow runs**. `+script` flag honored.
**Mode:** full-precision (structured spans with timestamps).
## PHASE 1 — EXECUTION NARRATIVE
The agent was asked to summarize the three most recent support tickets and draft a reply to the angriest one. Iteration 1 produced six consecutive reasoning frames — plan, decompose, re-verify ordering, re-check API assumptions, restate, confirm — with no tool call between any of them. Iteration 2 selected a retrieval tool and called `fetch_tickets(limit=50)`, which returned 50 full tickets at 9,800 tokens for a task needing three. Iteration 3 summarized tickets 1–3, each frame entering with a larger prompt context than the last (11,040 → 11,660 → 12,340). Iteration 4 fired three tool calls in strict sequence: account tier, ticket history, SLA policy. Iteration 5 dispatched `sentiment_rank(tickets)` and the log ends with no response and no timing — **UNVERIFIED span**, carried forward. No reply was ever drafted; the task did not complete.
## PHASE 2 — STACK RECONSTRUCTION
**Rendering: FLAMECHART** (time-ordered). Single trace, no repeated identical stacks to aggregate, and both Cliff and Staircase detection require preserved temporal order.
### 1. ASCII flamechart (latency, ~155ms/char)
```
AgentExecutor:support_agent .............................. 9,340ms
├iteration_1..├iteration_2....├iteration_3.........├iter_4..├i5
pl│re│re│rec│re│re│s│Tool:fetch_tickets│sum1..│sum2...│sum3...│t│th.│s│?
└─2,100ms──────────┘
```
### 2. d3-flame-graph JSON
```json
{"name":"AgentExecutor:support_agent","value":9340,
"meta":{"type":"reasoning","self":0,"estimated":false,"color":"green"},
"children":[
{"name":"ReAct:iteration_1","value":2220,"meta":{"type":"reasoning","self":0,"estimated":false,"color":"green"},"children":[
{"name":"Reason:plan","value":300,"meta":{"type":"reasoning","self":300,"estimated":false,"color":"green"}},
{"name":"Reason:decompose","value":400,"meta":{"type":"reasoning","self":400,"estimated":false,"color":"green"}},
{"name":"Reason:reverify_order","value":380,"meta":{"type":"reasoning","self":380,"estimated":false,"color":"green"}},
{"name":"Reason:recheck_api","value":450,"meta":{"type":"reasoning","self":450,"estimated":false,"color":"green"}},
{"name":"Reason:restate","value":350,"meta":{"type":"reasoning","self":350,"estimated":false,"color":"green"}},
{"name":"Reason:confirm","value":340,"meta":{"type":"reasoning","self":340,"estimated":false,"color":"green"}}]},
{"name":"ReAct:iteration_2","value":2340,"meta":{"type":"reasoning","self":0,"estimated":false,"color":"green"},"children":[
{"name":"Reason:select_tool","value":240,"meta":{"type":"reasoning","self":240,"estimated":false,"color":"green"}},
{"name":"Tool:fetch_tickets(limit=50)","value":2100,"meta":{"type":"tool_call","self":2100,"estimated":false,"color":"red"}}]},
{"name":"ReAct:iteration_3","value":3180,"meta":{"type":"reasoning","self":0,"estimated":false,"color":"yellow"},"children":[
{"name":"Reason:summarize_t1","value":980,"meta":{"type":"reasoning","self":980,"estimated":false,"color":"yellow"}},
{"name":"Reason:summarize_t2","value":1060,"meta":{"type":"reasoning","self":1060,"estimated":false,"color":"yellow"}},
{"name":"Reason:summarize_t3","value":1140,"meta":{"type":"reasoning","self":1140,"estimated":false,"color":"yellow"}}]},
{"name":"ReAct:iteration_4","value":1600,"meta":{"type":"reasoning","self":0,"estimated":false,"color":"blue"},"children":[
{"name":"Tool:fetch_account_tier","value":520,"meta":{"type":"tool_call","self":520,"estimated":false,"color":"blue"}},
{"name":"Tool:fetch_ticket_history","value":610,"meta":{"type":"tool_call","self":610,"estimated":false,"color":"blue"}},
{"name":"Tool:fetch_sla_policy","value":470,"meta":{"type":"tool_call","self":470,"estimated":false,"color":"blue"}}]},
{"name":"ReAct:iteration_5","value":0,"meta":{"type":"error","self":0,"estimated":true,"color":"red"},"children":[
{"name":"Tool:sentiment_rank[NO RESPONSE]","value":0,"meta":{"type":"error","self":0,"estimated":true,"color":"red"}}]}]}
```
### 3. Collapsed stacks
```
Task;ReAct:1;Reason:plan 300
Task;ReAct:1;Reason:decompose 400
Task;ReAct:1;Reason:reverify_order 380
Task;ReAct:1;Reason:recheck_api 450
Task;ReAct:1;Reason:restate 350
Task;ReAct:1;Reason:confirm 340
Task;ReAct:2;Reason:select_tool 240
Task;ReAct:2;Tool:fetch_tickets 2100
Task;ReAct:3;Reason:summarize_t1 980
Task;ReAct:3;Reason:summarize_t2 1060
Task;ReAct:3;Reason:summarize_t3 1140
Task;ReAct:4;Tool:fetch_account_tier 520
Task;ReAct:4;Tool:fetch_ticket_history 610
Task;ReAct:4;Tool:fetch_sla_policy 470
Task;ReAct:5;Tool:sentiment_rank 0
```
### Top 5 self-width nodes
| Node | Self (ms) | % of total |
|---|---|---|
| Tool:fetch_tickets | 2,100 | 22.5% |
| Reason:summarize_t3 | 1,140 | 12.2% |
| Reason:summarize_t2 | 1,060 | 11.3% |
| Reason:summarize_t1 | 980 | 10.5% |
| Tool:fetch_ticket_history | 610 | 6.5% |
All iteration frames have self = 0 — they are pure containers. The metric lives entirely in leaves.
## PHASE 3 — GEOMETRY READING (S.C.S.C. Scan™)
**S — SKYLINE: DETECTED** · nodes: `iteration_3` reasoning block (t1/t2/t3) · **confidence 82**
Pass 1 (ASCII): the widest unbroken green run in the chart, no tool bar interrupting it. Pass 2 (collapsed stacks): 980+1060+1140 = 3,180 / 9,340 = **34.0%**, above the 30% threshold, zero tool frames between. Both passes agree.
*Branch:* `iteration_1` is the same pathology — six consecutive reasoning frames, zero tools — but Pass 2 computes 2,220/9,340 = **23.8%**, sub-threshold. Reported as sub-threshold, not as a second detection. Its six frames are semantically redundant restatements (Analysis), which is the stronger reading; the competing reading is legitimate multi-step planning. Missing data that would settle it: the reasoning text bodies, absent from the trace.
**C — CLIFF: DETECTED (HARD CLIFF)** · node: `Tool:sentiment_rank` · **confidence 60**
Pass 1: terminal frame, no children, no sibling, chart ends. Pass 2: **no integer exists** for this node — the ≥5% width criterion is unmeasurable, so the arithmetic pass cannot confirm width, only termination. Span is UNVERIFIED from Phase 1 → R4 caps this at 60. The termination itself is explicit in the log, not inferred.
**S — STAIRCASE: NOT DETECTED** · region: `iteration_4` · **confidence 78**
Pass 1: three tool bars in strict sequence, classic staircase silhouette. Pass 2: 520+610+470 = 1,600 / 9,340 = **17.1%** serial, but a data dependency is visible — `fetch_sla_policy(tier="enterprise")` consumes the output of `fetch_account_tier`. The pattern requires ≥3 tools with *no* dependency; only two (`fetch_account_tier`, `fetch_ticket_history`) are independent. The staircase is partially legitimate. Passes agree on the numbers, disagree on nothing — the visual pattern is real, the verdict is suppressed by dependency evidence. A 2-way parallel opportunity survives and is prescribed below.
**C — CONTEXT DEBT: DETECTED** · nodes: `fetch_tickets` → `iteration_3` frames · **confidence 90**
Pass 1: prompt_tokens annotations climb monotonically down the iteration_3 lane. Pass 2: 11,040 → 11,660 → 12,340, monotonic across 3 frames, **+1,300 tokens** growth. Tokens inherited from `fetch_tickets`: **9,800**; tokens actually referenced by the task (3 tickets of 50): **~588** (Analysis — estimated as 3/50 of payload). Roughly **94% of carried context is unreferenced**. Both passes agree. Single-agent trace, so no upstream agent to name.
**Watch List:** iteration_1 reasoning redundancy (sub-threshold Skyline, 23.8%).
## PHASE 4 — PRESCRIPTION
Calibration check skipped — `{PREVIOUS_RUN_NOTES}` empty, first run.
Ordered by impact on **slow runs**:
**1. Context Debt → bound the retrieval payload**
Fix: change `fetch_tickets(limit=50)` to `limit=3` with server-side sort by recency, and add a projection returning only `{id, subject, body_excerpt, sentiment}`. Add a context-pruning step after iteration_2 that drops raw ticket payloads once summaries exist.
Expected geometry after fix: the `fetch_tickets` bar shrinks from ~22.5% to under 5% of total width; the three iteration_3 frames narrow proportionally as prompt_tokens on entry drop below ~2,000 and stop climbing monotonically.
Effort: **S**
**2. Cliff → timeout + retry wrapper on tool dispatch**
Fix: wrap all tool calls in a 10s timeout with one retry and a logged failure observation, so a non-responding tool returns an error observation the agent can react to instead of silently ending the run.
Expected geometry after fix: `sentiment_rank` renders with a measurable width and either a child observation frame or an explicit `error` node followed by a sibling — no terminal frame at trace end.
Effort: **S**
**3. Skyline → collapse the summarization loop into one batched call**
Fix: replace three sequential per-ticket summarize frames with a single call summarizing all three in one completion; add a max-depth guard of 3 consecutive reasoning frames without a tool call, which also suppresses the iteration_1 restatement chain.
Expected geometry after fix: iteration_3 drops from three ~1,000ms frames to one frame of roughly 1,200–1,500ms; the reasoning share of total width falls from 34.0% to under 20%. Iteration_1 collapses from six frames to two.
Effort: **M**
**4. Partial parallelization (not a DETECTED antipattern — opportunity only)**
Fix: dispatch `fetch_account_tier` and `fetch_ticket_history` concurrently; keep `fetch_sla_policy` sequential after tier resolves.
Expected geometry after fix: iteration_4 renders as a ⟨PARALLEL⟩ two-lane group of 610ms followed by a 470ms bar — 1,080ms total, saving 520ms (5.6% of trace).
Effort: **S**
## PHASE 5 — DECISION LOOP
Iteration 1 self-score: all DETECTED findings carry Pass 2 figures; Cliff at 60 is honestly demoted below 70 with R4 named as the cause, not hidden. R1–R5 hold. R3 satisfied — reconstructed stack is 3 levels.
`LOOP: iteration 1/2 → PASS`
**R8 — what to look at first next render, given slow runs:**
- The `fetch_tickets` bar. If it is still the widest self-width node, fix #1 did not land.
- The prompt_tokens annotations down iteration_3. Flat instead of climbing = context debt cleared.
- Whether iteration_5 has a width at all. A measurable bar there means the run now completes.
```
--- LOOP STATE (paste into {PREVIOUS_RUN_NOTES} next time) ---
run_date: 2026-07-27 | verdicts: SKYLINE→DETECTED/82 | CLIFF→DETECTED-HARD/60 | STAIRCASE→NOT DETECTED/78 | CONTEXT_DEBT→DETECTED/90
predictions: CONTEXT_DEBT→fetch_tickets self-width <5% of total, prompt_tokens flat across iteration_3 | CLIFF→sentiment_rank has measurable width + child observation or error sibling | SKYLINE→iteration_3 becomes one frame, reasoning share <20% | PARALLEL→iteration_4 renders as ⟨PARALLEL⟩ group ~1,080ms
next_run: apply chosen fixes, re-trace, paste this block + what you changed
--------------------------------------------------------------
```
```python
# flamegraph.py — renders this run's flamechart. python flamegraph.py
import matplotlib.pyplot as plt
from matplotlib.patches import Rectangle
C = {"green": "#4c9a52", "blue": "#3b73b9", "yellow": "#d3a327", "red": "#c0392b"}
TREE = {"name": "AgentExecutor:support_agent", "value": 9340, "self": 0, "color": "green", "children": [
{"name": "iter_1", "value": 2220, "self": 0, "color": "green", "children": [
{"name": "plan", "value": 300, "self": 300, "color": "green", "children": []},
{"name": "decompose", "value": 400, "self": 400, "color": "green", "children": []},
{"name": "reverify", "value": 380, "self": 380, "color": "green", "children": []},
{"name": "recheck_api", "value": 450, "self": 450, "color": "green", "children": []},
{"name": "restate", "value": 350, "self": 350, "color": "green", "children": []},
{"name": "confirm", "value": 340, "self": 340, "color": "green", "children": []}]},
{"name": "iter_2", "value": 2340, "self": 0, "color": "green", "children": [
{"name": "select_tool", "value": 240, "self": 240, "color": "green", "children": []},
{"name": "fetch_tickets", "value": 2100, "self": 2100, "color": "red", "children": []}]},
{"name": "iter_3", "value": 3180, "self": 0, "color": "yellow", "children": [
{"name": "sum_t1", "value": 980, "self": 980, "color": "yellow", "children": []},
{"name": "sum_t2", "value": 1060, "self": 1060, "color": "yellow", "children": []},
{"name": "sum_t3", "value": 1140, "self": 1140, "color": "yellow", "children": []}]},
{"name": "iter_4", "value": 1600, "self": 0, "color": "blue", "children": [
{"name": "acct_tier", "value": 520, "self": 520, "color": "blue", "children": []},
{"name": "ticket_hist", "value": 610, "self": 610, "color": "blue", "children": []},
{"name": "sla_policy", "value": 470, "self": 470, "color": "blue", "children": []}]},
{"name": "iter_5", "value": 200, "self": 200, "color": "red", "children": [
{"name": "sentiment_rank[NO RESP]", "value": 200, "self": 200, "color": "red", "children": []}]}]}
bars = []
def walk(node, x, depth):
bars.append((x, depth, node["value"], node["name"], node["self"], node["color"]))
cx = x
for ch in node["children"]:
walk(ch, cx, depth + 1)
cx += ch["value"]
walk(TREE, 0, 0)
maxd = max(b[1] for b in bars)
fig, ax = plt.subplots(figsize=(15, 1.0 + 0.75 * (maxd + 1)))
for x, d, w, name, self_w, col in bars:
ax.add_patch(Rectangle((x, d), w, 0.9, facecolor=C[col], edgecolor="white", lw=1.2))
if w / TREE["value"] > 0.025:
ax.text(x + w / 2, d + 0.45, f"{name}\n{self_w}ms self", ha="center", va="center",
fontsize=7, color="white")
ax.set_xlim(0, TREE["value"]); ax.set_ylim(maxd + 1, 0)
ax.set_xlabel("latency (ms)"); ax.set_yticks([]); ax.set_title("Agent flamechart — 9,340ms")
plt.tight_layout(); plt.savefig("flamegraph.png", dpi=150)
print("wrote flamegraph.png")
```
> Script note: `iter_5` is rendered at an **estimated** 200ms placeholder so the cliff is visible; the JSON records it as `value: 0, estimated: true`. This is the one place the renderer diverges from the emitted JSON, and it is flagged rather than silent.
---
### Process Improvement Notes
- The fallback spec resolves `{WIDTH_METRIC}` to `auto` but doesn't say what happens to a `+script` flag attached to the discarded metric. I honored it; the prompt should state it explicitly — one line: *"flags attached to {WIDTH_METRIC} survive the fallback; only the metric itself is overridden."*
- Phase 3's Staircase rule produces a NOT DETECTED verdict that still has a real fix behind it, but Phase 4 only prescribes for DETECTED antipatterns. Add a sanctioned "opportunity" slot to Phase 4, or the prescription I wrote as item 4 is technically off-spec.
- The `estimated` placeholder collision between the JSON (`value: 0`) and a renderable bar is a structural gap in the +script contract — worth one line in the script spec: *"zero-width nodes render at a 2% placeholder, labeled estimated."*

$29.99-25%
$22.49
SPECIAL PROMOTION — Offer ends 12 October

 Instant access
 Commercial use
 Money‑back
By purchasing this prompt, you agree to our terms of service
5.0
1 review
2
Favorites
128
Views
CLAUDE-5-OPUS


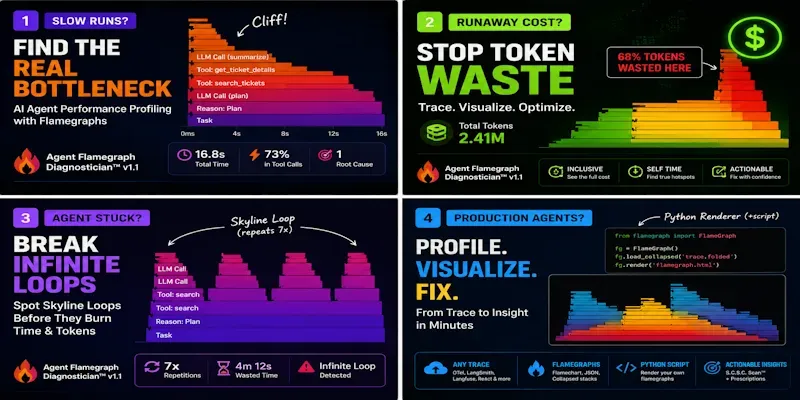
Paste an agent trace — OTel GenAI spans, LangSmith/Langfuse exports, framework callback logs, or a plain ReAct transcript — and get a flamegraph reconstruction of the run plus a scan for the four canonical agent antipatterns: Skyline (looping reasoning), Cliff (silent tool death), Staircase (missed parallelization), Context Debt (bloating history). Every finding is tied to a named trace event, never invented. Ships with ASCII render, d3-flame-graph JSON, and Brendan Gregg collapsed-stack format.
...more
Added over 1 month ago

- Reviews for this prompt (1)