

Prompt Details
Model
(claude-5-sonnet)
Token size
1,853
Example input
[SYSTEM_DESCRIPTION]: We have a deployment pipeline. After every deploy, an automated canary-analysis controller watches error rates for the new version. If the error rate crosses 5%, the canary controller automatically triggers a rollback to the previous version. Separately, our on-call engineer gets a PagerDuty alert if error rates cross 8%, and the on-call engineer can also manually force a rollback at any time. The canary controller pulls error-rate metrics every 60 seconds. PagerDuty alerts are configured against the same metrics stream.
[INCIDENT_OR_CONCERN]: On 2026-08-30, a deploy went out at 14:02. Error rates started climbing slowly right after — by 14:15 they were at 4.8%, just under the canary's 5% threshold. They kept climbing gradually and crossed 5% at 14:42, which should have triggered an automatic rollback. But the rollback didn't actually happen until 14:57, and it wasn't the canary that triggered it — the on-call engineer manually forced it after getting paged. We want to understand why the canary didn't roll back on its own when it crossed 5% at 14:42.
[CONTROL_AUTHORITY_MAP]: not provided
Example output
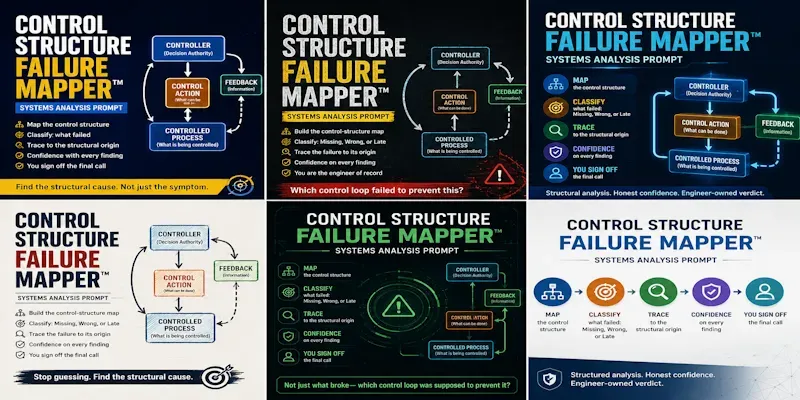
CONTROL-STRUCTURE MAP
Controllers:
- Canary-analysis controller (automated) — authority: trigger rollback
when error rate > 5%
- On-call engineer (human) — authority: force rollback at any time,
manually
Controlled process:
- Production deployment (the currently live version)
Control actions:
- CA-1: Canary controller triggers automatic rollback (condition: error
rate > 5%)
- CA-2: On-call engineer manually forces rollback (condition: any time,
discretionary)
Feedback channels:
- FC-1: Error-rate metrics stream → canary controller (polled every 60
seconds)
- FC-2: Error-rate metrics stream → PagerDuty → on-call engineer
(threshold: 8%)
Note: Authority Map was not provided. The 5% and 8% thresholds and the
"any time" manual authority are read directly from SYSTEM_DESCRIPTION —
flagged as VERIFIED, not inferred, since they were stated explicitly.
CLASSIFICATION TABLE
| Control Action | Classification | Confidence | Evidence Basis |
|---|---|---|---|
| CA-1 (canary auto-rollback at >5%) | LATE | VERIFIED | Error rate crossed 5% at 14:42 per INCIDENT_OR_CONCERN; canary is described as polling every 60 seconds, so it should have detected the crossing within roughly one polling interval of 14:42 and triggered rollback shortly after — not at 14:57, 15 minutes later |
| CA-2 (manual rollback) | PRESENT AND CORRECT | VERIFIED | On-call engineer did force rollback once paged; this action functioned as designed given it was triggered |
| FC-1 (metrics → canary) | WRONG | INFERRED | The canary must have received the >5% reading (metrics stream is shared with FC-2, which did fire), so the feedback data reached the controller — the failure is not in FC-1's data delivery but in what the canary controller did with it, which the input doesn't fully explain. Flagged INFERRED, not VERIFIED, because the input doesn't state directly why the canary failed to act once it had the data — only that it eventually did roll back at 14:57 |
| FC-2 (metrics → PagerDuty → on-call) | PRESENT AND CORRECT, but LATE relative to CA-1's threshold | VERIFIED | This channel worked as designed — it paged at the 8% threshold. The problem is not that FC-2 failed; it's that FC-2's threshold (8%) is set higher than CA-1's threshold (5%), so it functions as a 15-minute-plus delayed backstop rather than a fast-acting channel for this failure mode |
FAILURE PATH
Structural origin: CA-1 (canary automatic rollback) — LATE. The canary
should have rolled back near 14:42-14:43 based on its own stated 5%
threshold and 60-second polling interval. The input does not explain why
it did not act promptly at that point; this is the central open question
this analysis surfaces rather than resolves with a guess.
Propagation: Because CA-1 did not fire promptly, the system remained in
a degraded state from roughly 14:42 to 14:57 (15 minutes) with no
automatic correction. The only functioning safety net during that window
was FC-2 → on-call engineer, and that net has an 8% threshold — meaning
it is a slower, higher-bar backstop by design, not a fast-response
channel for a slow climb that lingers between 5% and 8%.
Proximate trigger: the on-call engineer's manual rollback at 14:57,
following a page. This stopped the incident but did not address why the
canary's own automatic path (CA-1) failed to act at its own stated
threshold.
CONFIDENCE SUMMARY
Confident (VERIFIED): the sequence of threshold crossings and timestamps
as stated; that CA-2 worked correctly once triggered; that FC-2 is
structurally a slower backstop than CA-1 by threshold design (8% vs 5%).
Inferred: that the metrics data did reach the canary controller (FC-1)
before 14:57, since a later rollback did occur through it — this is a
reasonable read, not a directly stated fact.
Unknown / needs investigation: the specific reason CA-1 did not trigger
promptly once the 5% threshold was crossed at 14:42. This is the single
biggest gap in this analysis and the highest-value next question — was
it a bug in the canary logic, a delay in its own internal action-taking
separate from data receipt, or something else not described in the
input?
ENGINEER-OF-RECORD NOTE: This is a structural analysis based on the
information provided, not a certified root cause. Verify against system
telemetry — specifically, canary-controller internal logs between 14:42
and 14:57 — and sign off with the engineer(s) of record before treating
any classification above as final.
```

 Instant access
 Commercial use
 Money‑back
By purchasing this prompt, you agree to our terms of service
5.0
1 review
2
Favorites
14
Views
CLAUDE-5-SONNET


This prompt takes your system description and an incident or concern, and
builds a control-structure map of your system before it analyzes anything.
Every finding traces back to a specific node in that map — a controller, a
feedback channel, a control action — not a vague "the deploy process is
fragile" guess.
...more
Added 1 week ago

- Reviews for this prompt (1)