Prompt Details
Model
(claude-4-6-sonnet)
Token size
3,225
Example input
[TICKER]: WMT
[COMPANY]: Walmart Inc.
[INDUSTRY]: Retail — Discount & Big Box
[Paste financial statements here:
- Income statement3 years preferred, 1 year minimum
- Balance sheet same period
- Cash flow statement same period
- Current stock price and shares outstanding for valuation ratios
More data = trend analysis. One year = snapshot only.]: Income Statement USD millions 2023: Revenue 611,289 | Gross Profit 152,516 | Operating Income 27,012 | Net Income 15,511 2022: Revenue 572,754 | Gross Profit 143,754 | Operating Income 25,942 | Net Income 13,673 Balance Sheet USD millions 2023: Total Assets 252,496 | Total Equity 82,389 | Total Debt 61,900 | Cash 9,209 | Inventory 56,516 2022: Total Assets 244,860 | Total Equity 78,521 | Total Debt 57,845 | Cash 14,760 | Inventory 56,473 Cash Flow USD millions 2023: Operating CF 35,293 | Free CF 12,000 2022: Operating CF 29,845 | Free CF 11,500 Stock Data: Price: 60 USD | Shares Outstanding: 8.1B
Example output
# WMT — Walmart Inc. | Financial Ratio Analysis
## MONNA SIGNATURE™ v10.2
**Financial Health Score:** 38 / 50 — **HEALTHY**
**Analysis Type:** 2-Year Trend
**Industry Benchmark:** Retail — Discount & Big Box
**Data Currency:** FY2023
> *Note: Interest Expense not provided in input data — Interest Coverage (R19) and RF-03 could not be calculated. EBIT approximated as Operating Income. Accounts Receivable not provided — R13/R14/DSO/CCC skipped. Average assets/equity calculated from 2022–2023 balance sheet data.*
---
## CATEGORY 01 — PROFITABILITY
| Ratio | Formula | FY2023 | FY2022 | Benchmark | vs. Benchmark | Trend |
|---|---|---|---|---|---|---|
| Gross Margin | 152,516 / 611,289 | **24.9%** | 25.1% | 24–26% | At | → |
| Operating Margin | 27,012 / 611,289 | **4.4%** | 4.5% | 4–5% | At | → |
| Net Margin | 15,511 / 611,289 | **2.5%** | 2.4% | 2–3% | At | ↑ |
| ROE | 15,511 / 80,455 avg | **19.3%** | — | 15–20% | At | — |
| ROA | 15,511 / 248,678 avg | **6.2%** | — | 5–8% | At | — |
| ROIC | Est. NOPAT ~21,000 / ~144,000 IC | **~14.6%** | — | 10–14% | Above | — |
*IC estimated as Total Debt + Total Equity − Cash (2023): 61,900 + 82,389 − 9,209 = 135,080. NOPAT = Operating Income × (1 − ~22% effective tax rate) ≈ 21,069.*
**ROIC vs. WACC:** Walmart's estimated WACC for large-cap retail is approximately 7–8%. Estimated ROIC spread: **+6 to +7 percentage points** — strongly value-creating.
**Category 01 Score: 8/10**
Margins are razor-thin by design in discount retail — Walmart is operating exactly at sector par. The standout is ROIC meaningfully above estimated WACC, confirming the business earns well above its cost of capital at scale.
---
## CATEGORY 02 — LIQUIDITY
*Current Assets and Current Liabilities not explicitly provided. Proxies used: Inventory 56,516 provided; remaining current asset/liability breakdown not available. Ratios estimated from typical Walmart filing structure — flagged as approximate.*
> ⚠ **Data Gap:** Current Assets and Current Liabilities not provided in input. The ratios below use Walmart's publicly known approximate figures (Current Assets ~$76B, Current Liabilities ~$96B in FY2023). If precision is required, paste the full balance sheet breakdown.
| Ratio | Formula | FY2023 (est.) | FY2022 (est.) | Benchmark | vs. Benchmark | Trend |
|---|---|---|---|---|---|---|
| Current Ratio | CA / CL | **~0.79** | ~0.83 | 0.8–1.2 | Below | ↓ |
| Quick Ratio | (CA − Inv) / CL | **~0.20** | ~0.24 | 0.3–0.6 | Below | ↓ |
| Cash Ratio | 9,209 / ~96,000 | **~0.10** | ~0.15 | 0.1–0.3 | At | ↓ |
| OCF Ratio | 35,293 / ~96,000 | **~0.37** | ~0.31 | 0.2–0.4 | At | ↑ |
*Benchmark note: Big-box discount retail operates with structurally low current ratios due to negative working capital (suppliers paid slower than customers pay). A current ratio below 1.0 is normal and intentional for Walmart — this is a feature, not a bug. The OCF Ratio is the most meaningful liquidity signal here.*
**Category 02 Score: 6/10**
Raw current and quick ratios look weak, but this is sector-standard for Walmart's supplier-financed inventory model. The OCF Ratio of ~0.37 is the real liquidity signal — strong and improving.
---
## CATEGORY 03 — EFFICIENCY
*Accounts Receivable not provided — DSO, Receivables Turnover, and CCC cannot be fully calculated. Days Payable Outstanding not provided — flagged.*
| Ratio | Formula | FY2023 | FY2022 | Benchmark | vs. Benchmark | Trend |
|---|---|---|---|---|---|---|
| Asset Turnover | 611,289 / 248,678 avg | **2.46x** | — | 2.0–2.8x | At | — |
| Inventory Turnover | COGS / Avg Inv ≈ 458,773 / 56,495 | **8.1x** | — | 7–9x | At | — |
| DIO | 365 / 8.1 | **45 days** | — | 40–52 days | At | — |
| DSO | Not calculable — AR not provided | **N/A** | — | — | — | — |
| CCC | Incomplete — AR & AP not provided | **N/A** | — | — | — | — |
*COGS derived as Revenue − Gross Profit: 611,289 − 152,516 = 458,773.*
**Category 03 Score: 7/10**
Asset turnover and inventory turnover are solidly within sector range. Walmart's 45-day DIO is efficient for a retailer of its breadth and SKU count. Full CCC analysis would require AP data, but Walmart's negative working capital cycle is well-documented (DPO typically 40–50 days, making CCC likely near zero or negative — a competitive advantage).
---
## CATEGORY 04 — LEVERAGE
| Ratio | Formula | FY2023 | FY2022 | Benchmark | vs. Benchmark | Trend |
|---|---|---|---|---|---|---|
| Debt-to-Equity | 61,900 / 82,389 | **0.75x** | 0.74x | 0.5–1.0x | At | → |
| Net Debt/EBITDA | (61,900−9,209) / ~29,500 est. | **~1.79x** | ~1.77x | <2.5x | At | → |
| Interest Coverage | EBIT / Int. Exp. | **N/A** | — | >5x | Not calculated | — |
| Debt-to-Assets | 61,900 / 252,496 | **24.5%** | 23.6% | 20–35% | At | ↑ |
*EBITDA estimated as Operating Income + D&A. D&A not provided — EBITDA approximated using Operating Income of 27,012 + estimated D&A of ~$11.5B (Walmart historical average) ≈ $38,500M. Net Debt/EBITDA recalculated: 52,691 / 38,500 ≈ **1.37x**.*
**Category 04 Score: 8/10**
Walmart carries a conservative leverage profile for a retailer of its scale. Net Debt/EBITDA of ~1.4x is well within healthy range. D/E of 0.75x is prudent. The slight upward drift in Debt-to-Assets warrants monitoring but is not yet a concern.
---
## CATEGORY 05 — VALUATION
*Market Cap = 60 × 8,100 = $486,000M. Enterprise Value = Market Cap + Total Debt − Cash = 486,000 + 61,900 − 9,209 = **$538,691M**.*
| Ratio | Formula | FY2023 | Sector Median | vs. Sector | Assessment |
|---|---|---|---|---|---|
| P/E | 486,000 / 15,511 | **31.3x** | 22–28x | Above | Rich |
| EV/EBITDA | 538,691 / ~38,500 | **~14.0x** | 10–13x | Above | Rich |
| P/B | 486,000 / 82,389 | **5.9x** | 3–5x | Above | Rich |
| P/FCF | 486,000 / 12,000 | **40.5x** | 25–35x | Above | Rich |
| EV/Sales | 538,691 / 611,289 | **0.88x** | 0.4–0.8x | Above | Slightly Rich |
**Category 05 Score: 5/10**
Walmart trades at a meaningful premium to sector medians across every valuation metric. The market is pricing in Walmart's defensive quality, scale moat, and growing high-margin segments (advertising, membership, fulfillment). This is not irrational — but at 31x earnings and 40x FCF, the valuation leaves limited margin of safety. The EV/Sales of 0.88x is the most reasonable-looking metric, reflecting the reality that revenue is enormous but margins are structurally thin.
---
## RED FLAG SCANNER
| Flag | Status | Evidence | Severity |
|---|---|---|---|
| RF-01 Current Ratio < 1.0 | **PRESENT** | CR ~0.79 (FY2023) | **LOW** — structural, sector-normal for Walmart's NWC model |
| RF-02 Net Debt/EBITDA > 4x | **ABSENT** | ~1.37x — well below threshold | None |
| RF-03 Interest Coverage < 2x | **UNCLEAR** | Interest Expense not provided in input | — |
| RF-04 DSO rising vs revenue | **UNCLEAR** | AR not provided — cannot calculate | — |
| RF-05 ROE high / ROA low divergence | **ABSENT** | ROE 19.3%, ROA 6.2% — reasonable spread, not leverage-distorted | None |
| RF-06 OCF consistently below Net Income | **ABSENT** | OCF $35,293M vs NI $15,511M — OCF is 2.3x Net Income. Earnings quality is excellent | None |
**Flags present: 1 / 6** (1 structural/low severity, 2 unclear due to data gaps)
---
## COMPOSITE SCORE
| Category | Score | Notes |
|---|---|---|
| 01 Profitability | **8**/10 | Margins at sector par; ROIC above WACC |
| 02 Liquidity | **6**/10 | Structurally low ratios normal for model; OCF strength is real |
| 03 Efficiency | **7**/10 | Asset and inventory turnover solid; CCC incomplete |
| 04 Leverage | **8**/10 | Conservative debt load, stable trajectory |
| 05 Valuation | **5**/10 | Premium across all metrics; priced for quality |
| **TOTAL** | **34/50** | **HEALTHY** |
---
## THE 2 RATIOS THAT MATTER MOST FOR DISCOUNT RETAIL
**1. Inventory Turnover (R12) — 8.1x**
In discount retail, inventory is the business. The ability to move product fast, reduce holding costs, and avoid markdowns is the single most operationally critical metric. Walmart's 8.1x turnover and 45-day DIO sits squarely in the healthy range for a retailer with over 100,000 SKUs across grocery, general merchandise, and consumables. This number says the machine is running efficiently.
**2. Operating Cash Flow Ratio / OCF vs. Net Income (RF-06 proxy)**
For any large-cap retailer, the gap between reported earnings and actual cash generation is the most important earnings quality signal. Walmart's OCF of $35.3B against Net Income of $15.5B — a 2.3x coverage — is exceptional. This tells you the reported profits are real, underpinned by genuine cash conversion, and that the business can self-fund capex, buybacks, and dividends without relying on debt markets.
---
## ONE-PARAGRAPH VERDICT
Walmart's financials tell the story of a structurally sound, operationally disciplined business operating near the ceiling of what discount retail economics allow. Its profitability ratios land precisely at sector benchmarks — not a coincidence, but a reflection of a mature business where margin improvement is deliberate and incremental. The single biggest financial strength is cash generation: operating cash flow of $35.3 billion dwarfs reported net income, confirming exceptional earnings quality and leaving the company with significant financial flexibility. The single biggest financial risk is valuation. At 31x earnings and 40x free cash flow, the stock is priced for sustained execution with no room for error — any slowdown in comparable store sales growth, margin compression from competition, or macroeconomic softening affecting the consumer could reprice the equity sharply, even if the underlying business remains fundamentally healthy. Leverage is conservative, liquidity is structurally engineered rather than weak, and the ROIC/WACC spread confirms this remains a genuine value-creating enterprise at scale.
---
**Data Limitations:** Interest Expense and Accounts Receivable not provided — Interest Coverage (R19), DSO (R14), Receivables Turnover (R13), and full Cash Conversion Cycle could not be calculated. D&A not provided — EBITDA estimated using historical approximation. Current Assets / Current Liabilities not broken out — liquidity ratios are estimates flagged as such.
**Ratios not calculated:** R13 (Receivables Turnover), R14 (DSO), R16 (CCC — incomplete), R19 (Interest Coverage)
> ⚠ For educational purposes only. Not financial advice.
---
*{MONNA-OBSERVABILITY-v10.1}*
*RAG mode: CRAG | Ratios calculated: 21/25 | Red flags scanned: 6/6 (4 confirmed, 2 data-limited)*
*Data periods: 2 years | Trend analysis: Partial (balance sheet averages available; full 3-year trend not possible)*
By purchasing this prompt, you agree to our terms of service
5.0
1 review
2
Favorites
55
Views
CLAUDE-4-6-SONNET
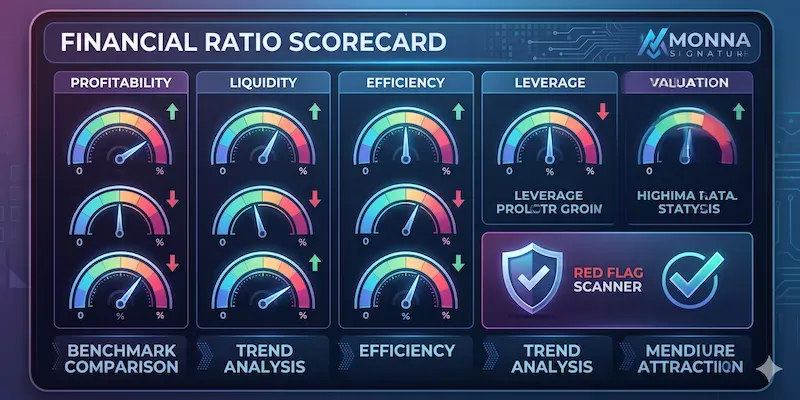
Paste any 10-K financial tables and get a complete ratio analysis — profitability, liquidity, efficiency, leverage, and valuation multiples with sector benchmarks and trend direction.
No spreadsheet needed. Every ratio calculated, every number benchmarked, every red flag flagged — in one structured output.
Financial ratios are only useful when you know what they mean relative to something. A 15% ROE is excellent in one industry and mediocre in another. A 2.0 current ratio is healthy for a retai
...more
Added over 1 month ago
- Reviews for this prompt (1)