

Prompt Details
Model
Chat - (gpt-5.5)
Token size
805
Example input
[SKILL_TO_MASTER]: Python for data analysis (pandas, data cleaning, and charts)
[CURRENT_LEVEL]: a complete beginner who is comfortable with basic spreadsheets but has never coded
[DURATION]: 8 weeks
[DAILY_TIME]: 60 minutes
[END_GOAL]: land a junior data-analyst role
Example output
Week 1 ΓÇö Python Foundations Fast
Goals
Apply Python basics by writing and running 15 small scripts using variables, lists, loops, and functions with ≥80% correct outputs.
Analyse spreadsheet-like tasks and convert at least 5 manual spreadsheet workflows into Python steps.
Create a simple command-line program that loads, transforms, and summarizes a small CSV file in under 50 lines.
Resources (priority order)
Python Official Tutorial
Automate the Boring Stuff with Python
freeCodeCamp Python for Beginners (YouTube)
Why this week matters
You build the programming mental model needed before touching pandas; this replaces spreadsheet-only thinking with repeatable code workflows.
Practice
Guided: Load a CSV of monthly expenses, calculate totals/averages, and print category summaries step by step.
Independent: Build a mini ΓÇ£sales reportΓÇ¥ script from raw CSV data without copying examples.
Reflection
Why is a loop more scalable than manual spreadsheet editing?
How do variables and functions reduce human error in repetitive analysis?
Self-check
I can write a loop processing 20+ rows without syntax help.
I can explain functions and variables aloud in plain language in under 3 minutes.
I can solve 8/10 beginner Python exercises unaided within 20 minutes.
Daily plan
Day 1 (60m): Install Python + VS Code/Jupyter; variables, types, print.
Day 2 (60m): Lists, loops, conditionals; retrieval quiz from Day 1.
Day 3 (60m): Functions and CSV reading practice.
Day 4 (60m): Debugging exercises + deliberate repetition.
Day 5 (60m): Teach-it-back: explain loops/functions aloud or in notes.
Day 6 (60m): Build expense-tracker mini script.
Day 7 (60m): Spaced review + self-test from memory only.
Week 2 ΓÇö DataFrames and Core Pandas
Goals
Apply pandas operations to inspect and filter datasets with ≥90% task completion.
Analyse differences between spreadsheet tables and DataFrames using 3 real examples.
Create a notebook that imports, filters, sorts, and summarizes a dataset with markdown explanations.
Resources
pandas Documentation ΓÇö Getting Started
Kaggle Python & Pandas Micro-Courses
Python for Data Analysis by Wes McKinney
Why this week matters
You move from raw Python toward analyst-style workflows using tabular data structures.
Practice
Guided: Import a CSV into pandas and answer business questions using filtering and aggregation.
Independent: Explore a public dataset and produce 5 insights without instructions.
Reflection
Why are vectorized pandas operations faster and clearer than loops?
When would spreadsheets still outperform pandas?
Self-check
I can filter rows using multiple conditions correctly 5 times consecutively.
I can explain DataFrame, Series, and indexing without notes.
I can complete a basic pandas notebook in under 45 minutes.
Daily plan
Day 1: DataFrames, Series, importing CSVs.
Day 2: Filtering, selecting columns, sorting; retrieval from Day 1.
Day 3: Groupby and aggregation practice.
Day 4: Deliberate exercises using multiple operations together.
Day 5: Feynman explanation of DataFrames vs spreadsheets.
Day 6: Analyse a real dataset independently.
Day 7: Spaced review + mixed Python/pandas quiz.
Week 3 ΓÇö Clean Messy Data
Goals
Apply data-cleaning methods to datasets containing missing values, duplicates, and bad formatting with ≥85% accuracy.
Analyse causes of poor data quality across 3 datasets.
Create a reusable cleaning workflow notebook with comments and checkpoints.
Resources
pandas User Guide ΓÇö Missing Data
Data Cleaning Challenge datasets on Kaggle
Python for Data Analysis by Wes McKinney
Why this week matters
Junior analysts spend large amounts of time cleaning data before analysis; this is one of the most employable skills.
Practice
Guided: Clean a customer-orders dataset containing missing dates, duplicate IDs, and inconsistent categories.
Independent: Design your own cleaning pipeline for a messy public dataset.
Reflection
Why can dropping missing data distort conclusions?
How would you document cleaning choices for teammates?
Self-check
I can identify and fix at least 4 types of dirty data.
I can explain when to fill vs remove missing values.
I can clean a dataset of 1,000+ rows within 45 minutes.
Daily plan
Day 1: Missing values and duplicates.
Day 2: String cleaning, type conversion; retrieval review.
Day 3: Cleaning workflow exercises.
Day 4: Combine cleaning + analysis tasks.
Day 5: Teach cleaning logic aloud step-by-step.
Day 6: Independent cleaning project.
Day 7: Spaced review + cumulative self-test.
Week 4 ΓÇö Charts and Data Stories
Goals
Apply visualization techniques to produce 5 readable charts from real datasets.
Analyse which chart types best communicate different business questions.
Create a short visual report combining cleaned data and narrative insights.
Resources
Matplotlib Documentation
pandas Visualization Guide
Storytelling with Data by Cole Nussbaumer Knaflic
Why this week matters
Analysts are hired to communicate findings clearly, not just calculate numbers.
Practice
Guided: Build line, bar, histogram, and scatter plots from sales data.
Independent: Produce a one-page visual dashboard answering a business question.
Reflection
Why can a misleading chart create bad business decisions?
How do visuals change depending on audience needs?
Self-check
I can choose appropriate chart types for 8/10 scenarios.
I can generate and label charts without copying syntax.
I can explain one chartΓÇÖs business insight in under 2 minutes.
Daily plan
Day 1: Basic plotting with pandas and matplotlib.
Day 2: Labels, formatting, multiple chart types.
Day 3: Visualization drills with new datasets.
Day 4: Deliberate chart redesign practice.
Day 5: Teach chart-choice reasoning aloud.
Day 6: Create a mini visual report.
Day 7: Spaced review + mixed-data challenge.
Week 5 ΓÇö Midpoint Analyst Project
Goals
Create an end-to-end mini analysis project using cleaning, analysis, and visualization.
Analyse strengths and weaknesses in your workflow using a post-project review.
Apply retrieval practice by rebuilding key steps from memory with ≥70% accuracy.
Resources
Kaggle Datasets
Real Python pandas Tutorials
Previous weeksΓÇÖ notes and notebooks.
Why this week matters
This milestone proves you can already perform the core workflow expected in junior analyst screening tasks.
Practice
Guided: Follow a structured exploratory data analysis (EDA) workflow on a business dataset.
Independent (Milestone): Complete a full notebook from raw CSV to charts and recommendations.
Reflection
Which part of the workflow slows you down most and why?
How would you explain your findings to a non-technical manager?
Self-check
I can complete a full analysis notebook in under 2 hours split across sessions.
I can explain every cleaning decision in plain English.
I can identify at least 3 actionable insights from a dataset.
Daily plan
Day 1: Review cumulative concepts.
Day 2: Guided EDA workflow.
Day 3: Continue project independently.
Day 4: Improve charts and explanations.
Day 5: Feynman walkthrough of your notebook.
Day 6: Rebuild core sections from memory.
Day 7: Mock analyst task timed session.
Week 6 ΓÇö Advanced Analysis Workflow
Goals
Apply joins, merges, pivot tables, and time-based analysis on multi-table datasets.
Analyse relationships between variables using grouped summaries and comparisons.
Create a reproducible workflow notebook using modular functions.
Resources
pandas User Guide ΓÇö Merge, Join, Concatenate
Python for Data Analysis by Wes McKinney
Khan Academy Statistics and Probability
Why this week matters
Real analyst tasks involve combining datasets and identifying patterns across multiple sources.
Practice
Guided: Merge customer and transaction datasets to calculate retention or revenue metrics.
Independent: Build a pivot-table-driven analysis replicating a spreadsheet dashboard in pandas.
Reflection
Why can incorrect joins silently corrupt analysis?
How does automation improve reproducibility compared with spreadsheets?
Self-check
I can perform all major join types correctly on sample datasets.
I can explain pivot tables in both spreadsheet and pandas terms.
I can solve a multi-table analysis task in under 60 minutes.
Daily plan
Day 1: Merging and joining.
Day 2: Pivot tables and reshaping; retrieval review.
Day 3: Time-series basics and grouped analysis.
Day 4: Deliberate mixed-operation exercises.
Day 5: Explain joins and pivots aloud.
Day 6: Build spreadsheet-to-pandas conversion project.
Day 7: Spaced review + cumulative test.
Week 7 ΓÇö Portfolio and Interview Readiness
Goals
Create two polished portfolio projects suitable for GitHub or job applications.
Analyse analyst interview questions and answer 10 common technical prompts correctly.
Apply communication skills by presenting findings verbally in 5 minutes or less.
Resources
GitHub Docs
Kaggle Projects and Notebooks
Search for: ΓÇ£junior data analyst SQL/Python interview questionsΓÇ¥ from reputable education platforms.
Why this week matters
Technical skill alone is not enough; hiring managers need evidence, communication, and professionalism.
Practice
Guided: Refactor an earlier notebook into a polished portfolio piece.
Independent: Present a complete analysis verbally while screen-sharing or recording yourself.
Reflection
What separates an ΓÇ£interesting chartΓÇ¥ from a business recommendation?
How would you adapt your analysis for executives versus technical peers?
Self-check
I can explain my projects confidently without reading notes.
I can answer 7/10 junior analyst technical questions correctly.
I can publish a clean GitHub repository with documentation.
Daily plan
Day 1: Portfolio structure and GitHub basics.
Day 2: Refactor and document project 1.
Day 3: Build or improve project 2.
Day 4: Mock technical interview exercises.
Day 5: Teach-it-back presentation rehearsal.
Day 6: Cross-project improvement and polish.
Day 7: Spaced review + interview self-test.
Week 8 ΓÇö Real Analyst Simulation
Goals
Create a complete analyst-style project from raw data to presentation under realistic constraints.
Analyse business questions independently and justify methodological choices.
Apply all prior skills with ≥80% success on a timed mock assessment.
Resources
Kaggle Datasets
Previous notebooks, error logs, and review notes.
Search for realistic ΓÇ£take-home data analyst assignmentsΓÇ¥ from reputable companies or bootcamps.
Why this week matters
This simulates the actual hiring workflow for junior analyst roles and validates end-to-end readiness.
Practice
Guided: Review a checklist for professional analysis workflow.
Independent (Final Simulation):
Choose a dataset.
Clean and analyse it.
Produce charts.
Write business recommendations.
Deliver within a strict timebox (split across the week).
Reflection
Which analytical habits now feel automatic?
What remaining weaknesses would most affect job performance?
Self-check
I can complete a full analyst workflow independently.
I can explain and defend all analysis choices clearly.
I can produce a portfolio-ready notebook with readable visuals and conclusions.
Daily plan
Day 1: Define business questions and inspect data.
Day 2: Clean and structure datasets.
Day 3: Perform analysis and aggregations.
Day 4: Build visuals and summaries.
Day 5: Present findings aloud and revise.
Day 6: Timed mock assessment from scratch.
Day 7: Final spaced review + retrospective.
Adaptivity Rule
If any weekΓÇÖs self-check score is below roughly 70%:
Revisit only the weak concepts rather than restarting everything.
Try a different explanation source (video instead of text, or vice versa).
Add 2ΓÇô3 extra review days before advancing.
Redo one earlier exercise entirely from memory.
Use retrieval practice first, then reread resources only after identifying gaps.
Learning Science Built Into The Plan
Spaced repetition: weekly Day 7 reviews + cumulative exercises.
Retrieval practice: frequent memory-only coding and quizzes.
Interleaving: later weeks mix cleaning, visualization, and analysis together.
Feynman technique: weekly teach-it-back sessions.
Bloom’s taxonomy progression: remember → apply → analyse → create.
Zone of proximal development: guided tasks first, independent transfer second.
SMART goals: measurable weekly outputs tied directly to analyst job skills.



Get this prompt + 9 more with SelectFrom $14/mo · Cancel anytimeFrom $14/mo · Cancel anytime
View Select
 Instant access
 Commercial use
 Money‑back
By purchasing this prompt, you agree to our terms of service
6
Views
GPT-5.5


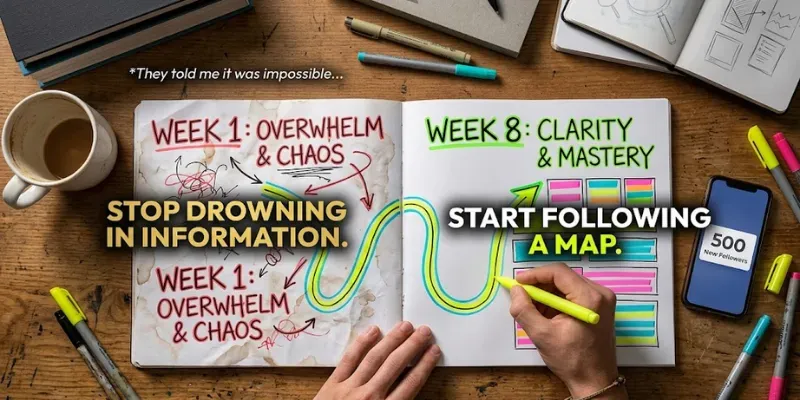
Generate a complete, week-by-week learning roadmap to master any skill, built on proven learning science. Each week gives SMART objectives, the best resources, guided and independent practice, reflection questions, an I-can self-check, and a day-by-day schedule that fits your exact daily time, with midpoint and final milestones. For self-learners, students, and career-switchers. Recommends only real resources, never fakes. Five variables set the skill, level, duration, daily time, and goal.
...more
Added over 1 month ago
