


Prompt Details
Model
Chat - (gpt-5.6)
Token size
1,663
Example input
[SYSTEM_ARCHITECTURE]: Next.js frontend, Node.js API, PostgreSQL, Redis, durable job queue, background AI workers, external LLM API, Docker on AWS.
[CURRENT_PROBLEMS_OR_RISKS]: Interactive requests become slow during AI-generation spikes. Queue depth rises, workers remain busy longer, and database CPU also increases. The team believes PostgreSQL needs a larger instance.
Example output
## 1. DIAGNOSTIC SUMMARY
**DIAGNOSTIC STATUS: PARTIALLY SUPPORTED**
The current evidence does **not** support the team's conclusion that PostgreSQL requires a larger instance.
The strongest current pattern is:
**AI-generation spike → AI work duration increases → workers stay occupied longer → queue depth rises → shared database activity increases → interactive request latency degrades**
But the causal direction is unresolved. PostgreSQL may be:
* a primary contention source,
* a secondary victim of heavier AI-job activity,
* or an amplifier through connection/lock/query contention.
### Current diagnosis
| Finding | Classification |
| -------------------------------------------------------------------------- | ----------------- |
| AI-generation spikes correlate with interactive request slowdown | **CONFIRMED** |
| Queue depth increases during those spikes | **CONFIRMED** |
| Workers remain busy longer | **CONFIRMED** |
| PostgreSQL CPU rises concurrently | **CONFIRMED** |
| PostgreSQL capacity is the root bottleneck | **PLAUSIBLE** |
| Worker/database shared-resource contention causes interactive degradation | **HIGHLY LIKELY** |
| External LLM latency contributes to longer worker occupancy | **PLAUSIBLE** |
| Simply increasing PostgreSQL instance size will solve the incident pattern | **WEAK SIGNAL** |
The immediate engineering objective should be to determine **whether interactive traffic and AI workers are contending for the same database resources** before scaling PostgreSQL.
---
# 2. SYSTEM & CRITICAL PATH MAP
## Reconstructed Architecture
```text
CLIENT
↓
Next.js Frontend
↓
Node.js API
├── Redis
├── PostgreSQL
└── Durable Job Queue
↓
AI Workers
├── PostgreSQL
├── Redis / Queue
└── External LLM API
```
Deployment:
```text
Docker workloads
↓
AWS infrastructure
```
## Incomplete Topology
**UNKNOWN**
The input does not specify:
* API replica count;
* worker replica/concurrency count;
* database connection-pool configuration;
* whether API and workers use the same PostgreSQL pool/database;
* queue technology;
* Redis role beyond presence;
* LLM timeout/retry behavior;
* job transaction boundaries;
* whether workers write intermediate state repeatedly;
* AWS compute/database instance classes;
* autoscaling behavior;
* rate limiting;
* observability stack.
These omissions materially affect the diagnosis.
---
## Interactive Critical Path
```text
USER REQUEST
↓
Next.js
↓
Node.js API
↓
Application Logic
↓
PostgreSQL / Redis
↓
RESPONSE
```
Potential contention points:
* API event loop;
* PostgreSQL connection pool;
* PostgreSQL CPU;
* locks;
* shared hot rows/tables;
* Redis;
* container CPU/memory.
---
## AI Job Critical Path
```text
REQUEST
↓
API
↓
QUEUE
↓
AI WORKER
├── READ STATE FROM POSTGRESQL
├── CALL EXTERNAL LLM
├── PROCESS RESPONSE
└── WRITE RESULT TO POSTGRESQL
```
### Boundaries
**Synchronous**
* frontend → API;
* API → PostgreSQL;
* worker → PostgreSQL;
* worker → external LLM API.
**Asynchronous**
* API → queue → worker.
### State changes
Likely:
* job creation;
* job status transitions;
* AI result persistence;
* retry state;
* application-domain updates.
Exact implementation: **UNKNOWN**.
---
# 3. OBSERVED SYMPTOMS
### Symptom A — Interactive requests become slow during AI-generation spikes
**CONFIRMED**
Important implication:
The interactive request path is probably affected by a resource also influenced by AI workloads.
Potential shared resources include:
* PostgreSQL;
* Node/API compute;
* Redis;
* network;
* container host resources.
---
### Symptom B — Queue depth rises
**CONFIRMED**
This proves:
**arrival rate > completion rate during the affected interval.**
It does **not** prove insufficient worker count.
Possible explanations include:
* external LLM calls taking longer;
* database operations taking longer;
* worker concurrency saturation;
* retries;
* rate limits;
* long jobs;
* worker CPU starvation.
---
### Symptom C — Workers remain busy longer
**CONFIRMED**
This is diagnostically important because increased service time alone can produce queue growth.
Unknown:
Whether the additional time is spent:
* waiting for PostgreSQL;
* waiting for the LLM;
* blocked on connections;
* executing CPU-heavy code;
* retrying requests.
---
### Symptom D — PostgreSQL CPU rises
**CONFIRMED**
This does not determine whether PostgreSQL is:
```text
CAUSE
```
or:
```text
EFFECT
```
of the AI-generation spike.
---
# 4. FAILURE SURFACE
## Application/API
### API resource contention
**PLAUSIBLE**
If API containers and AI workers share AWS compute capacity, AI workload spikes may reduce resources available to interactive workloads.
Missing evidence:
* CPU per container;
* memory;
* event-loop lag;
* container throttling;
* host saturation.
---
## PostgreSQL
### Query workload amplification
**HIGHLY LIKELY**
AI spikes probably cause additional reads/writes.
The key unresolved question is whether database CPU growth comes from:
```text
normal additional work
```
or:
```text
pathological expensive work.
```
---
### Connection-pool contention
**PLAUSIBLE**
Workers and API instances may compete for database connections.
A saturated worker-side pool or database-wide connection ceiling could increase interactive latency even before CPU reaches full saturation.
---
### Slow AI-related queries
**PLAUSIBLE**
Potential examples:
* repeated job-state polling;
* large result writes;
* expensive status lookups;
* missing indexes;
* excessive intermediate updates.
No query evidence supplied.
---
### Lock contention
**PLAUSIBLE**
Worker writes and interactive operations could contend over:
* job records;
* account rows;
* usage counters;
* quota rows;
* shared aggregate tables.
No lock telemetry supplied.
---
## Queues / Workers
### Worker service-time growth
**HIGHLY LIKELY**
Workers demonstrably remain busy longer.
The unresolved component is **where that time is spent**.
---
### External dependency latency
**PLAUSIBLE**
AI workers call an external LLM.
Longer provider latency would create:
```text
longer worker occupancy
→ lower job throughput
→ queue growth
```
without any worker-count deficiency.
---
### Retry amplification
**PLAUSIBLE**
If LLM or DB calls retry aggressively:
```text
dependency slowdown
→ retries
→ more work
→ greater DB/API load
→ further slowdown
```
Retry telemetry is absent.
---
## Architecture
### Shared-resource coupling between interactive and batch workloads
**HIGHLY LIKELY**
This is currently the most important architecture-level hypothesis.
Interactive traffic and AI workloads share at least PostgreSQL and potentially additional infrastructure.
---
# 5. COMPETING CAUSAL HYPOTHESES
## H1 — AI workers saturate PostgreSQL
**CONFIDENCE: PLAUSIBLE**
### Supporting evidence
* PostgreSQL CPU rises with AI-generation spikes.
* AI workers likely access PostgreSQL.
* interactive requests slow simultaneously.
### Contradicting evidence
None supplied.
### Missing evidence
* query-level CPU;
* DB wait events;
* worker query rate;
* API query latency;
* query plans;
* connection utilization.
### Discriminating test
Segment PostgreSQL workload by:
```text
API connections
vs.
AI-worker connections
```
during a spike.
Determine which workload consumes additional DB time.
---
## H2 — External LLM latency lengthens job execution, producing queue growth and secondary DB load
**CONFIDENCE: PLAUSIBLE**
### Supporting evidence
Workers remain busy longer during AI spikes.
### Contradicting evidence
No external-provider latency data.
### Missing evidence
* LLM request latency;
* timeout rate;
* rate-limit responses;
* retry counts.
### Discriminating test
Correlate per-job duration with:
```text
LLM_WAIT_TIME
DB_TIME
LOCAL_PROCESSING_TIME
```
---
## H3 — Database connection contention delays interactive requests
**CONFIDENCE: PLAUSIBLE**
### Supporting evidence
Both workloads probably access PostgreSQL.
### Contradicting evidence
No connection-pool evidence.
### Missing evidence
* pool wait duration;
* checked-out connections;
* PostgreSQL session count;
* connection acquisition latency.
### Discriminating test
Instrument connection acquisition separately for:
* Node API;
* AI workers.
---
## H4 — AI workers execute inefficient/high-frequency database operations
**CONFIDENCE: PLAUSIBLE**
Potential pattern:
```text
AI SPIKE
→ HIGH JOB VOLUME
→ EXCESSIVE DB OPERATIONS
→ DB CPU
→ INTERACTIVE QUERY LATENCY
```
### Missing evidence
Queries/job and total DB time/job.
### Discriminating test
Measure:
```text
DB queries per AI job
DB CPU time per job
rows scanned per job
```
---
## H5 — PostgreSQL instance is genuinely compute-bound
**CONFIDENCE: PLAUSIBLE**
### Supporting evidence
CPU rises during affected periods.
### Contradicting evidence
High CPU alone does not establish insufficient capacity.
### Missing evidence
* CPU level and duration;
* DB wait composition;
* query throughput;
* latency under controlled load;
* I/O utilization;
* lock waits.
### Discriminating test
Run controlled workload analysis while measuring throughput and latency versus database resource utilization.
---
## H6 — Worker concurrency creates a positive feedback loop
**CONFIDENCE: PLAUSIBLE**
Possible chain:
```text
AI DEMAND ↑
→ MORE ACTIVE WORKERS
→ DB LOAD ↑
→ JOB DB OPERATIONS SLOWER
→ WORKERS HELD LONGER
→ QUEUE DEPTH ↑
→ MORE PENDING WORK
```
This would make additional workers potentially harmful.
### Discriminating test
Reduce worker concurrency temporarily during a controlled load test and compare:
* throughput;
* DB CPU;
* queue age;
* interactive p95.
---
# 6. BOTTLENECK / FAILURE CHAINS
## Supported chain
**PARTIALLY SUPPORTED**
```text
AI-GENERATION DEMAND SPIKE
↓
WORKERS BUSY LONGER
↓
JOB COMPLETION RATE FALLS RELATIVE TO ARRIVAL RATE
↓
QUEUE DEPTH RISES
```
The first three observations are directly consistent with the supplied evidence.
---
## Candidate shared-resource chain
**HIGHLY LIKELY, NOT CONFIRMED**
```text
AI WORKLOAD SPIKE
↓
DATABASE WORKLOAD INCREASE
↓
POSTGRESQL RESOURCE / QUERY CONTENTION
↓
INTERACTIVE DATABASE OPERATIONS SLOW
↓
USER REQUEST LATENCY
```
The middle causal link remains unproven.
---
## Possible dependency-amplification chain
**PLAUSIBLE**
```text
LLM LATENCY / RATE LIMITING
↓
WORKER SERVICE TIME ↑
↓
WORKER OCCUPANCY ↑
↓
QUEUE DEPTH ↑
↓
CONCURRENT JOB STATE / RETRY ACTIVITY ↑
↓
DATABASE LOAD ↑
```
Requires telemetry.
---
# 7. EVIDENCE GAPS
## Highest-value gap — Where is worker time spent?
Measure:
```text
JOB_TOTAL_DURATION
LLM_WAIT_DURATION
DB_DURATION
DB_CONNECTION_WAIT
QUEUE_WAIT
LOCAL_PROCESSING_DURATION
```
### Decision enabled
Determines whether to investigate:
* the LLM dependency;
* PostgreSQL;
* worker implementation;
* concurrency configuration.
---
## Database workload attribution
Measure separately:
```text
API DB TIME
WORKER DB TIME
```
plus query fingerprints.
### Decision enabled
Determines whether AI workers are materially degrading interactive workload.
---
## PostgreSQL wait profile
Measure:
* CPU utilization;
* lock waits;
* I/O waits;
* active sessions;
* connection saturation;
* top queries by total execution time.
### Decision enabled
Distinguishes:
```text
compute saturation
vs.
query inefficiency
vs.
locking
vs.
connection pressure
vs.
storage pressure.
```
---
## Interactive latency segmentation
Measure API latency with DB timing separated.
Example:
```text
REQUEST_TOTAL = 1300 ms
DB = 850 ms
REDIS = 15 ms
APP = 35 ms
OTHER_WAIT = 400 ms
```
### Decision enabled
Determines whether PostgreSQL is actually on the interactive latency path.
---
## Queue age
Measure both:
```text
QUEUE DEPTH
OLDEST JOB AGE
```
### Decision enabled
Depth alone is ambiguous.
Oldest-job age reveals whether the queue is experiencing genuine service degradation.
---
## Retry counts
Measure retries by:
* LLM call;
* database operation;
* entire job.
### Decision enabled
Determines whether retry amplification is contributing to the spike.
---
# 8. DIAGNOSTIC EXPERIMENT MATRIX
| Test | Question Answered | Measurement | If True | If False | Risk | Stop Condition |
| --------------------------------------- | --------------------------------------- | ------------------------------ | ------------------------------------------ | ----------------------------- | ------ | -------------------------------- |
| Segment DB traffic by API vs worker | Who creates DB load? | DB time/query volume by client | Worker DB workload spikes | Worker DB usage stable | Low | Attribution is clear |
| Measure job phase timing | Why are workers busy longer? | LLM/DB/local time | One stage dominates | No individual stage dominates | Low | ≥90% job duration explained |
| Measure DB connection wait | Is pool contention hurting API? | connection acquisition latency | Wait rises during spike | Wait remains negligible | Low | Clear correlation/no correlation |
| Inspect top SQL fingerprints | Are expensive queries responsible? | total DB time/query | Small query set dominates | Load broadly distributed | Low | Main DB cost identified |
| Controlled worker-concurrency reduction | Does concurrency amplify DB contention? | API p95, DB CPU, throughput | API improves without major throughput loss | No meaningful improvement | Medium | Signal clearly directional |
| LLM latency correlation | Is provider latency extending jobs? | LLM p95 vs job duration | Strong temporal correlation | Stable provider latency | Low | Dependency hypothesis resolved |
---
# 9. SMALLEST JUSTIFIED INTERVENTIONS
## Intervention 1 — Add workload attribution before scaling PostgreSQL
**WHY NOW**
Current evidence cannot distinguish DB cause from DB symptom.
**EVIDENCE**
Concurrent AI load, DB CPU and interactive latency increases.
**EXPECTED MECHANISM**
Separating worker/API DB activity identifies the causal workload.
**TRADE-OFF**
Small observability implementation cost.
**ROLLBACK**
Instrumentation can be removed or reduced.
**VALIDATION**
One production spike should reveal which workload accounts for increased DB time.
---
## Intervention 2 — Instrument worker phase timing
**WHY NOW**
Workers are confirmed to remain busy longer.
**EXPECTED MECHANISM**
Decomposes job duration into:
```text
QUEUE
DB
LLM
APPLICATION
```
**TRADE-OFF**
Minor telemetry overhead.
**VALIDATION**
Most job execution time should become attributable to measurable stages.
---
## Intervention 3 — If worker DB contention is confirmed, cap worker concurrency before scaling DB
**WHY NOW**
Only after evidence demonstrates worker-driven DB contention.
**EXPECTED MECHANISM**
Reduce concurrent DB pressure while maintaining controlled throughput.
**TRADE-OFF**
Jobs may wait longer in the queue.
**ROLLBACK**
Restore previous worker concurrency.
**VALIDATION**
Compare:
* interactive p95;
* DB CPU;
* queue age;
* job throughput.
---
## Intervention 4 — Optimize dominant worker queries if identified
**WHY NOW**
Only if query attribution identifies expensive SQL.
Possible interventions:
* index correction;
* query rewrite;
* transaction shortening;
* reduced polling;
* batch updates.
**VALIDATION**
Lower DB time/job without functional regression.
---
# 10. CHANGES NOT YET JUSTIFIED
## Larger PostgreSQL instance
**NOT YET JUSTIFIED**
Reason:
CPU correlation exists, but the database bottleneck mechanism has not been demonstrated.
---
## Add more workers
**NOT JUSTIFIED**
Could worsen:
```text
DB contention
rate limiting
retry amplification
external dependency pressure
```
---
## Introduce microservices
**NOT JUSTIFIED**
No evidence of an ownership, deployment, isolation or independent-scaling problem requiring decomposition.
---
## Replace PostgreSQL
**NOT JUSTIFIED**
No evidence indicates a fundamental PostgreSQL limitation.
---
## Add more caching
**NOT JUSTIFIED**
No evidence shows repeated read-heavy workload is the relevant bottleneck.
---
## Replace the queue
**NOT JUSTIFIED**
Queue depth appears to be a symptom; no queue malfunction is demonstrated.
---
# 11. VALIDATION PLAN
Establish a baseline for:
```text
Interactive API p50 / p95 / p99
AI job duration
Queue wait age
PostgreSQL CPU
DB query latency
DB connection wait
LLM latency
Worker concurrency
```
Then reproduce or observe an AI-generation spike.
Compare:
```text
NORMAL WINDOW
vs.
SPIKE WINDOW
```
Validate causal relationships using aligned timestamps.
A successful intervention should improve the intended metric **without merely shifting the bottleneck**.
Example:
```text
worker concurrency ↓
API p95 ↓
DB CPU ↓
but queue age ↑ slightly
```
may be an acceptable controlled trade-off.
But:
```text
API p95 ↓
queue age ↑ 10×
```
would indicate an unacceptable capacity sacrifice.
---
# 12. OPERATIONAL RISKS
### Retry storms
**UNKNOWN**
Must be checked because dependency or DB slowdown can multiply work.
### Queue starvation
**PLAUSIBLE**
Long AI jobs may occupy worker capacity disproportionately.
### Database exhaustion
**PLAUSIBLE**
Particularly if worker concurrency and DB connections scale independently.
### Cascading latency
**HIGHLY LIKELY ARCHITECTURAL RISK**
Shared PostgreSQL infrastructure creates a path through which background workload can potentially degrade interactive traffic.
### External LLM partial degradation
**PLAUSIBLE**
The current architecture exposes job throughput to external service latency and rate limits.
### Weak observability
**HIGHLY LIKELY**
Current evidence is insufficient to identify which stage dominates job duration or database pressure.
---
# 13. ENGINEERING HANDOFF
### FIRST THING TO MEASURE
**Per-workload PostgreSQL time: API versus AI workers.**
Instrument query duration, connection wait and total database time separately for both workloads during an AI spike.
This has the highest diagnostic value because it directly tests the team's PostgreSQL hypothesis.
### FIRST TEST TO RUN
**Correlate AI-job phase timing with interactive p95 and PostgreSQL pressure.**
For each AI job, measure:
```text
DB TIME
LLM TIME
LOCAL PROCESSING TIME
TOTAL JOB TIME
```
Then compare them against:
```text
API p95
DB CPU
QUEUE AGE
```
during the same intervals.
### FIRST CHANGE IF CONFIRMED
If AI-worker database concurrency is confirmed as the contention source:
**reduce/cap worker DB concurrency before increasing database capacity.**
Then measure whether interactive latency improves while acceptable AI throughput is maintained.
### DO NOT CHANGE YET
Do not yet:
```text
upgrade PostgreSQL instance
add workers
split services
replace PostgreSQL
replace the queue
add broad caching
```
None is supported strongly enough by current evidence.
### ESCALATION TRIGGER
A PostgreSQL capacity increase becomes justified if controlled measurements show:
```text
efficient/indexed queries
+
low lock contention
+
healthy connection configuration
+
sustained DB compute saturation
+
latency increasing with DB utilization
+
required throughput exceeding current capacity
```
At that point, database scaling addresses demonstrated capacity pressure rather than presumed causality.
### DIAGNOSTIC STATUS
**PARTIALLY SUPPORTED**
The architecture shows a credible shared-resource contention pattern, but the evidence does not yet establish PostgreSQL capacity as the primary cause.


 Instant access
 Commercial use
 Money‑back
By purchasing this prompt, you agree to our terms of service
1
Favorites
15
Views
GPT-5.6


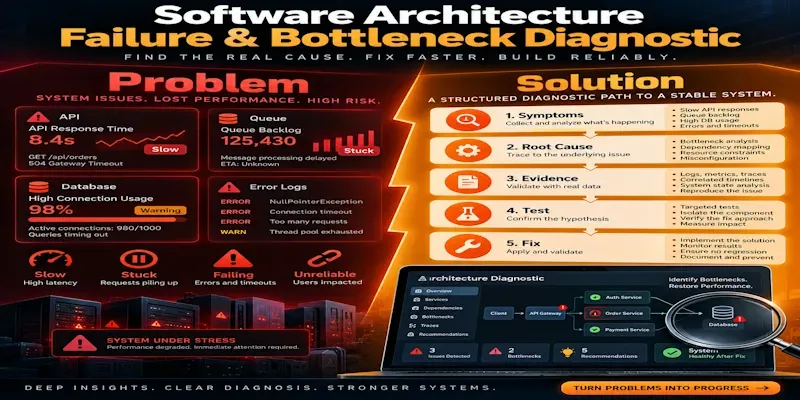
Diagnose where a software architecture is actually failing before redesigning it. Maps critical paths, builds competing causal hypotheses, identifies missing telemetry, and defines discriminating tests before recommending changes. Produces bottleneck chains, diagnostic experiments, smallest justified interventions, validation rules, and a practical engineering handoff.
...more
Added over 1 month ago
